Beyond Vanity Metrics: Turning SEO Data into Revenue and Decisions

You open Google Analytics weekly and see encouraging numbers: sessions increased 12%, bounce rate dropped to 54%, average time on page is 2:34. You celebrate organic traffic growth from 8,000 to 11,000 monthly visitors. However, when the CFO asks about SEO’s revenue impact, hesitation sets in.
There’s data abundance, but the connection between metrics and actual business results remains foggy. You know traffic grew, but can’t say whether they were qualified visitors who convert or just curious browsers who bounce quickly.
This vanity metrics trap is common. Celebrating a 50% increase in sessions without questioning the commercial value of that traffic and creating “green” dashboards while pipeline and revenue remain stagnant. Marketing celebrates KPIs isolated from business reality, and leadership starts questioning the ROI of SEO that doesn’t translate into paying customers.
The turning point happens when data stops being passive observation and starts driving decisions. “Traffic grew 30%” doesn’t guide action. However, “bottom-funnel articles about topic X grew 30%, generated 15 leads and three sales of $20k, while top-funnel content grew 40% without conversions” clearly points where to invest and where to cut back. Transform metrics into decision questions, not decorative reports.
Beyond Traffic: Metrics That Actually Matter
Session volume is just the starting point. Growth is only positive when there’s potential to generate commercial value. Ten thousand qualified visitors beat one hundred thousand curious browsers. The first question needs to be who these visitors are and how close they are to converting.
Traffic qualification analyzes signals of fit with the ICP. In B2B SaaS, this includes companies versus individuals, target sectors, and in-depth research behaviors. In e-commerce, it involves served regions and consistent navigation through product pages. These patterns indicate real intent, not mere curiosity.
Micro-conversions throughout the funnel are also revealing. Visitors who advance from ToFu (Top of Funnel) to MoFu (Middle of Funnel), download materials, and watch demos demonstrate clear progression. Mapping this journey shows which content actually moves prospects, rather than just inflating numbers.
Google Analytics 4: Critical Changes for SEO
GA4 abandons the session model and treats everything as an event. This expands flexibility but requires conscious configuration. CTA clicks, relevant scrolls, and form submissions need to be manually defined to make analytical sense.
Explorations offer analytical power far superior to standard reports. They allow answering specific business questions, like conversion paths between content pieces. The learning curve is steeper, but the clarity gain is proportional.
For more mature operations, BigQuery integration enables advanced analysis and custom attribution models. It’s not essential for everyone, but transforms analytics into a strategic data foundation when used well.
Connecting Organic Traffic to Real Conversions
Tracking should reflect the entire journey: signups, downloads, key views, trials, demos, and purchases. Without this, analytics shows only movement, not results. The first step isn’t looking at charts but clearly defining what success means.
Multi-touch attribution models help understand organic’s real role in long journeys. SEO is rarely last click but frequently the discovery point or decisive support. Ignoring this underestimates its impact.
Integrating analytics with CRM closes the loop to revenue. When a lead becomes an opportunity and customer, the origin can be traced to specific content. This visibility transforms SEO from cost center to predictable growth engine. Connect analytics to CRM to speak the language of revenue, not just traffic.
Segmentations That Reveal Hidden Insights
Segmenting by content type exposes important imbalances. Sometimes 20% of traffic generates 60% of conversions. Without segmentation, this signal gets lost in misleading averages.
Analyzing landing pages shows which URLs convert above average and which attract traffic without return. The former deserve pattern replication; the latter require expectation adjustment, repositioning, or acceptance as awareness plays.
Segments by device, region, and demographics also reveal opportunities. Large conversion differences indicate UX problems, market fit issues, or clear chances for targeted expansion.
User Behavior in Depth
Navigation flows show whether the journey is intuitive or confusing. Clear paths to conversion indicate good architecture; excessive dispersion suggests friction.
Exit page analysis helps identify bottlenecks. Exiting from informational articles is normal; exiting from pricing or checkout pages signals a problem worth investigating.
Qualitative tools like heatmaps and session recordings complement numerical data. They explain the “why” behind numbers, revealing obstacles invisible in traditional reports and enabling much more precise optimizations.
Identifying Underperforming Content
Pages with high traffic but low engagement waste clear opportunity. An article that ranks well and generates visits but shows an 85% bounce rate and 30-second average time clearly isn’t satisfying search intent. In this scenario, it makes sense to optimize content to better align with intent, improve scannability, add depth or practical examples. In some cases, the right decision is accepting that the term attracts audience outside the ICP and deprioritizing it.
Audit pages with high traffic and low engagement before producing any new content.
Orphan pages with no traffic at all also require action. Maintaining dozens or hundreds of old URLs receiving zero visits dilutes focus and authority. A “dead-weight” content audit enables clear decisions:
- Consolidate multiple superficial articles into one more complete piece
- Update outdated content that still makes strategic sense
- Definitively delete irrelevant pages
The goal isn’t more content but maintaining only what contributes real value.
Keyword cannibalization is another frequent problem. When multiple pages compete for the same term, authority fragments. Search Console data showing three URLs ranking for the same keyword in positions 8, 12, and 15 indicates a strong consolidation candidate. Analyzing keywords by URL exposes these patterns and creates quick win opportunities.
How Niara Transforms Google Search Console Data into Actionable Insights
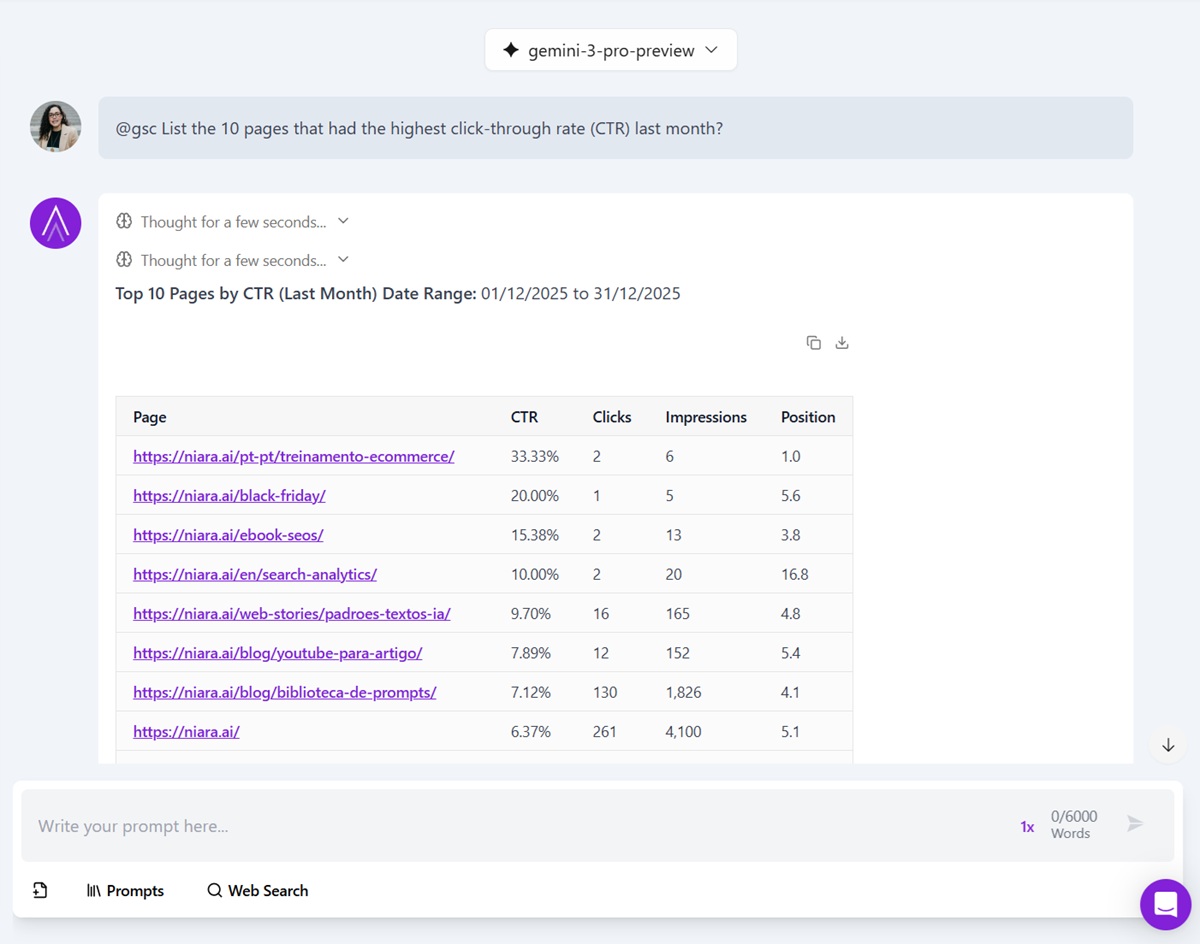
Niara’s Search Analytics module supercharges Google Search Console data into a single layer of conversational analysis. Instead of navigating through fragmented reports of clicks, impressions, CTR, and average position, the user interacts directly with this data through ChatSEO, asking questions in natural language and exploring scenarios in real-time.
This approach allows you to identify clear cause-and-effect relationships directly from Search Console, such as variations in average position, loss of CTR, or changes in impression patterns. A typical insight extracted within the platform would be:
“This page maintained average position but lost CTR because emerging new queries started competing for attention in the same result.”
Or:
“This set of pages receives many impressions but few clicks—small title and description optimizations can unlock quick traffic gains.”
Instead of automatically “alerting” you, Niara allows the professional to actively discover problems by directly asking Search Console things like: which pages are losing visibility?, which terms dropped in position?, or which URLs have good average positioning but are underutilized in clicks? This eliminates reliance on continuous manual monitoring and transforms analysis into an investigative process guided by questions.
Use direct questions in ChatSEO to identify pages with high impressions and low CTR, as this is one of the fastest paths to organic gains without creating new content. Explore emerging queries and intent variations within Search Console to adjust existing content before relevance loss consolidates.
Another differentiator lies in prioritization based on real impact. By exploring data conversationally, the platform helps answer questions like: which pages need urgent optimization?, which content types have a longer lifecycle?, or where can simple adjustments generate disproportionate visibility gains?
Instead of generating generic lists of “100 opportunities,” Niara guides focus to what really matters at that moment, based on real Search Console signals. Right below the data provided by Niara, you will see insights (analysis) and a list of optimization suggestions you can perform.

This is what we call Conversational Analytics: the ability to speak with your data in ChatSEO without needing complex spreadsheets.
For other reports such as Quick Wins, Cannibalization, and Conversational Queries, you can access an analysis with up to 25,000 queries from your Search Console with just one click! Much more data and efficiency for your analyses.
Simplify your data analysis today and discover insights that GSC hides.
Reports That Communicate Value to Stakeholders
The executive summary needs to translate technical metrics into business impact. CTR, positions, or sessions mean nothing to leadership if not connected to real results. The report should start with clear answers about leads, opportunities, and revenue, and only then explain the technical factors that led to those results.
Visualizations also need to tell a story. Dashboards with dozens of graphs without narrative confuse. Structure the report as a logical sequence:
- Defined objective
- Executed actions
- Observed impact
- Final business result
Period-over-period comparison provides context to progress. Absolute numbers are empty without reference. Month-over-month and year-over-year growth reveals trends, not just isolated snapshots.
Monthly Executive Report Template
- Executive Summary (1 paragraph)
- Key business metrics: leads, conversions, attributed revenue
- Main highlight of the month
- Maximum priority for next period
- Traffic Performance
- Organic traffic vs previous month vs previous year
- Breakdown by content type (ToFu / MoFu / BoFu)
- Top pages by traffic and conversion
III. Rankings and Visibility
- Keywords in Top 10 (growth)
- Relevant gains and losses
- Share of voice vs competitors
- Conversions and Impact
- Conversions by type
- Conversion rate vs previous period
- Revenue or attributed pipeline
- Completed Projects
- What was implemented
- Expected vs observed impact
- Next Period Plan
- 3 to 5 priority initiatives
- Required resources
- Expected outcomes
Transforming Insights into Strategic Decisions
Data-based prioritization replaces HiPPO (Highest Paid Person’s Opinion). When data shows that one topic converts five times more than another, the right decision is independent of executives’ personal preference. This reduces internal politics and increases objectivity.
Controlled experiments allow validating hypotheses with lower risk. Testing some content before investing in a complete cluster, or comparing different formats on a small scale, avoids big bets in wrong directions.
The learning loop institutionalizes continuous improvement. Each experiment generates documented learnings that inform future decisions. Over quarters, the organization builds proprietary knowledge about what works for its audience—something no generic best practice delivers.
Avoiding Common Interpretation Pitfalls
The first pitfall is confusing correlation with causation. Simultaneous growth doesn’t mean direct relationship; seasonality, external backlinks, or algorithm changes may be the true factors.
The second is cherry-picking to confirm pre-existing bias. Data that contradicts hypotheses is more valuable than confirming data, as it forces strategic refinement.
The third is infinite analysis without action. Waiting for 95% certainty usually generates less results than acting with 70% confidence and learning quickly.
Practical Cases of Data-Driven Decisions
Case 1:Titles with “checklist” converted 3x more → template prioritization → average conversion rose from 2.1% to 6.3%
Case 2:Searches for “alternatives to competitor” → creation of comparison pages → 25% of high-value pipeline
Case 3: CTA below the fold on mobile → repositioning → +45% conversion
Case 4:Enterprise traffic converted 8x more → focus on enterprise content → sales cycles 30% shorter
Building Data-Driven Culture
Data accessibility democratizes insights. Self-service dashboards allow teams to act without depending on monthly reports.
Training is essential. Access without context generates wrong interpretations. Teaching how to read data, avoid biases, and transform numbers into actions is part of the strategy.
Rapid iteration values continuous learning. Launching something imperfect, measuring, and adjusting beats any overly rigid planning.
Conclusion
Analytics without interpretation is just noise. Value emerges when data is actively questioned and used to guide real choices. Organizations that learn faster build sustainable competitive advantage.
Use data to decide with speed, not to justify decisions already made.
The differentiator lies in interpreting context and acting—asking the right questions and performing optimizations. For companies that take SEO seriously as a growth engine, mastering analytics isn’t optional—it’s what separates empty traffic from real revenue impact.
Stop struggling with spreadsheets and complex data! Use Niara to boost your productivity and efficiency with analytics.